Science
The questions we explore
A total solar eclipse gives a few minutes when the Sun’s outer atmosphere can be studied from the ground. These are the questions that work is built around.
- 01
Why is the corona so hot?
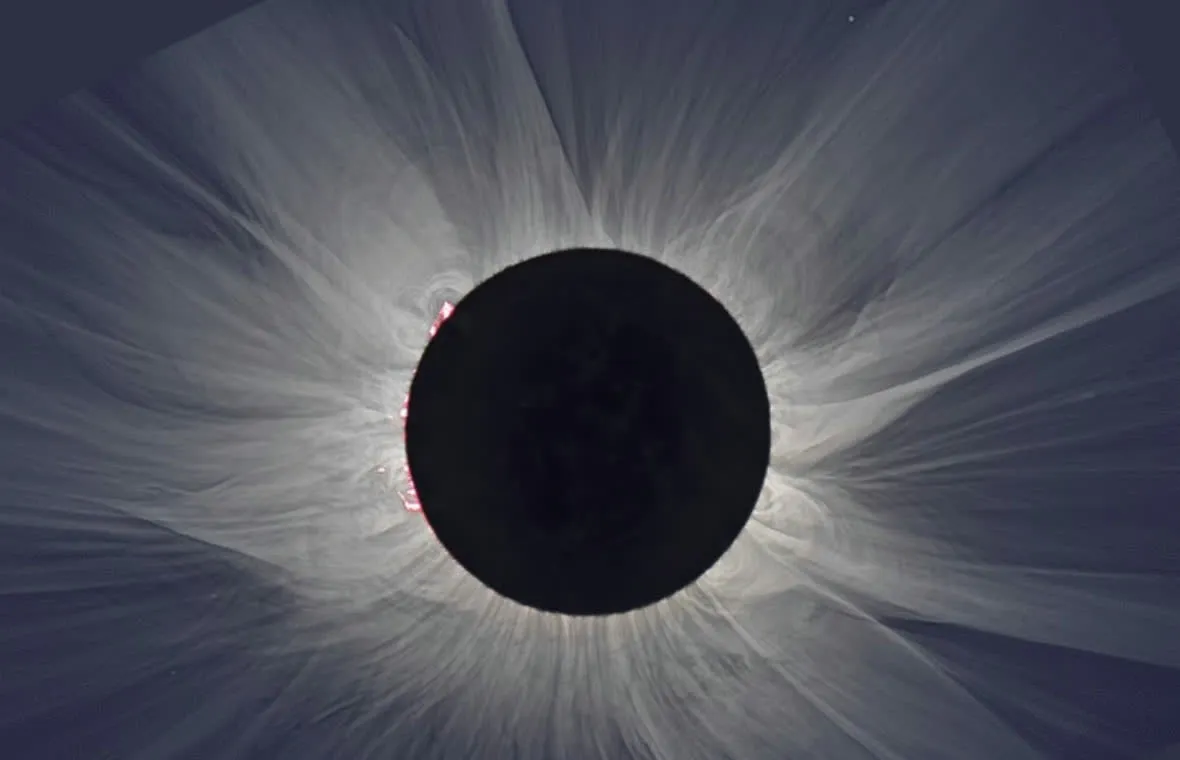
The Sun’s visible surface is much cooler than the corona above it. How that heat is arranged, and how it relates to magnetic structure, is one of the central problems in solar physics. Eclipse images are one way to see that arrangement.
- 02
Where does the solar wind begin?
The solar wind is the stream of particles that flows out from the Sun and past Earth. It is launched in the inner corona. These observations look for where that happens, and how it differs from one coronal structure to another.
- 03
How do the corona and its magnetic fields change?
Streamers, loops, and prominences trace the corona’s large-scale structure. Repeating the same kinds of observations from eclipse to eclipse shows how that structure evolves, including across the solar cycle.
Why eclipses
Why total eclipses matter
The corona is the Sun’s outer atmosphere. Its visible light is faint, and it is usually lost in the glare of the solar surface. When the Moon covers that surface, the corona — and the prominences at its edge — can be photographed from the ground.
Spacecraft and other observatories study the corona throughout the year. Eclipse observations complement those measurements. During totality, Solar Wind Sherpas record the corona in white light, through narrow-band filters on emission lines of ionized iron, and with spectrometers. Those data are used to examine the corona’s structure, temperature, and motion, and its connection to the solar wind.
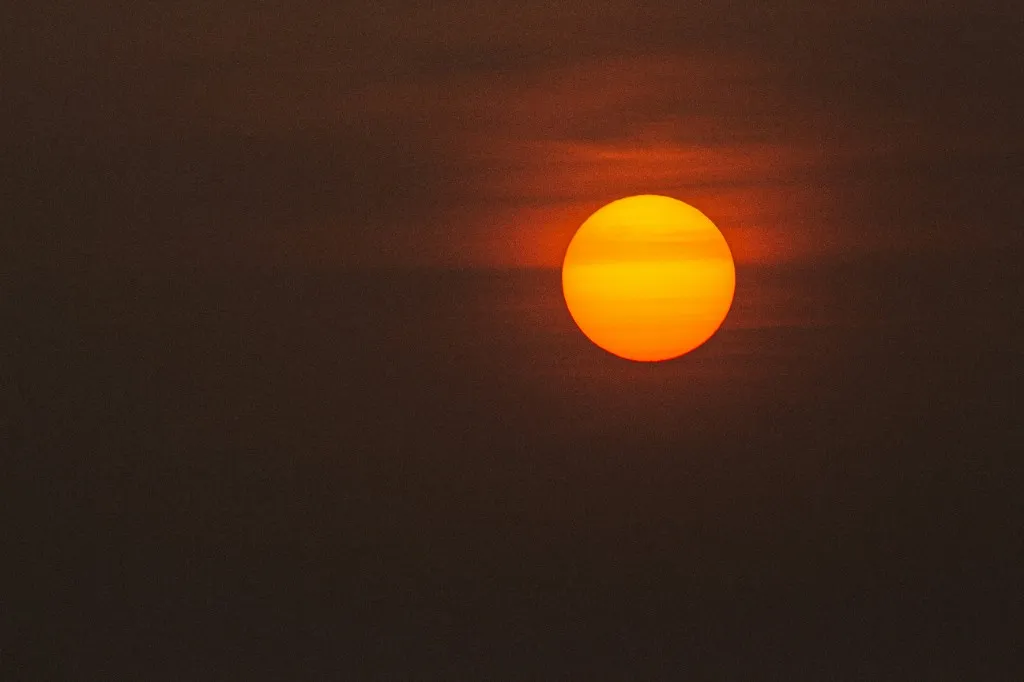
Hidden in the glareThe bright solar disk. Its light overwhelms the faint corona. 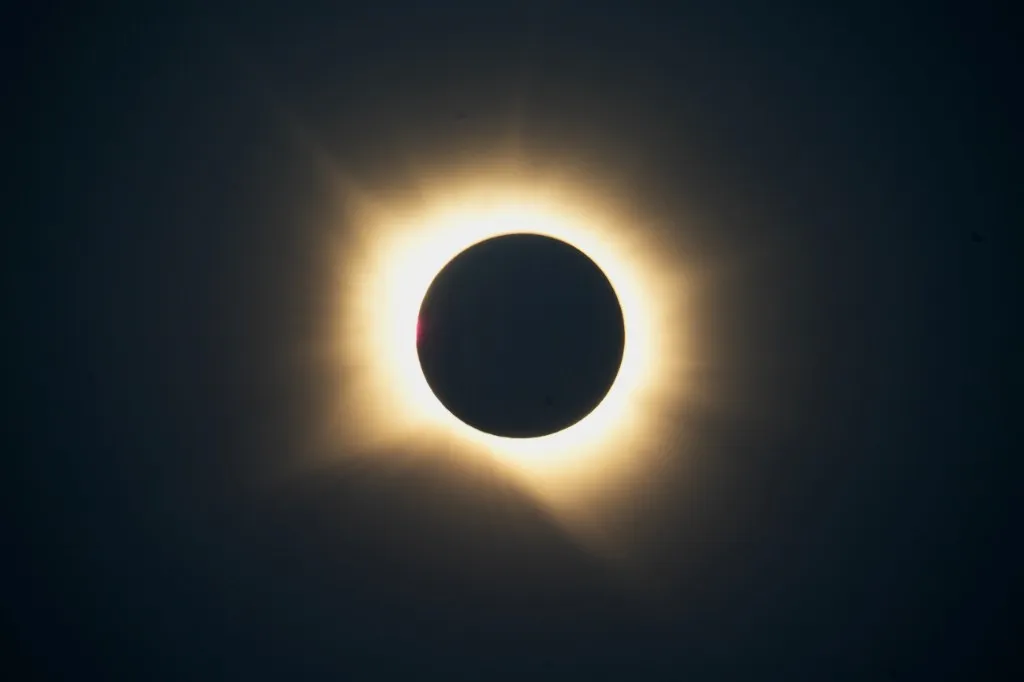
Revealed by the MoonDuring totality the disk is covered and the corona can be recorded. 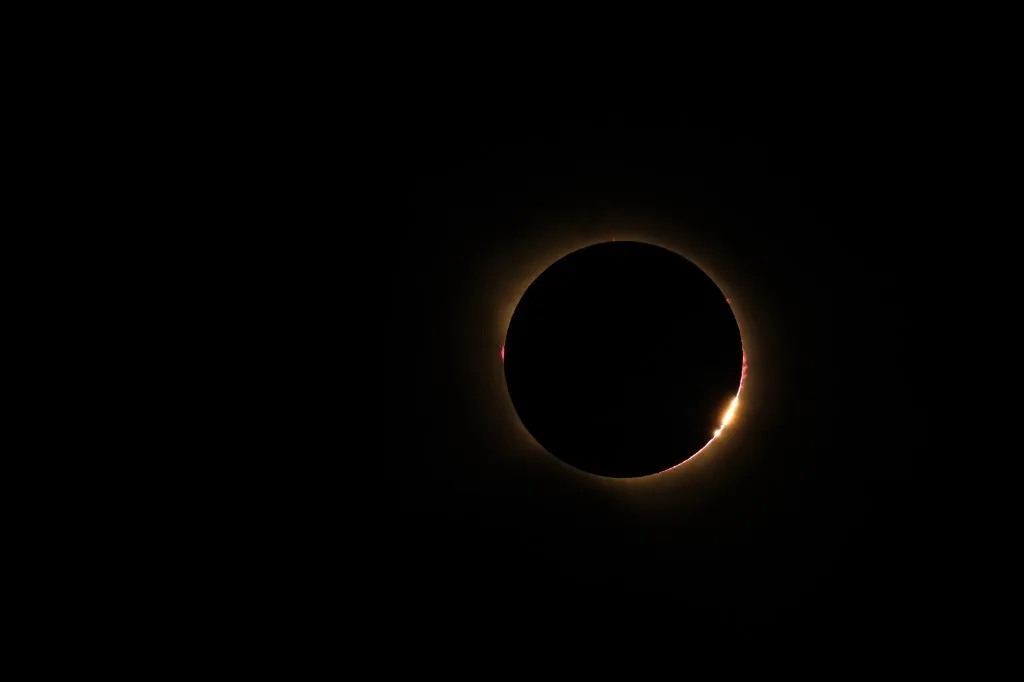
At the Moon’s limbProminences appear along the edge of the Moon.
In the field
Equipment & instruments
The expeditions travel with white-light cameras, narrow-band filters, and spectrometers. They are set up on site and used together during totality. The photographs show that work in the field.
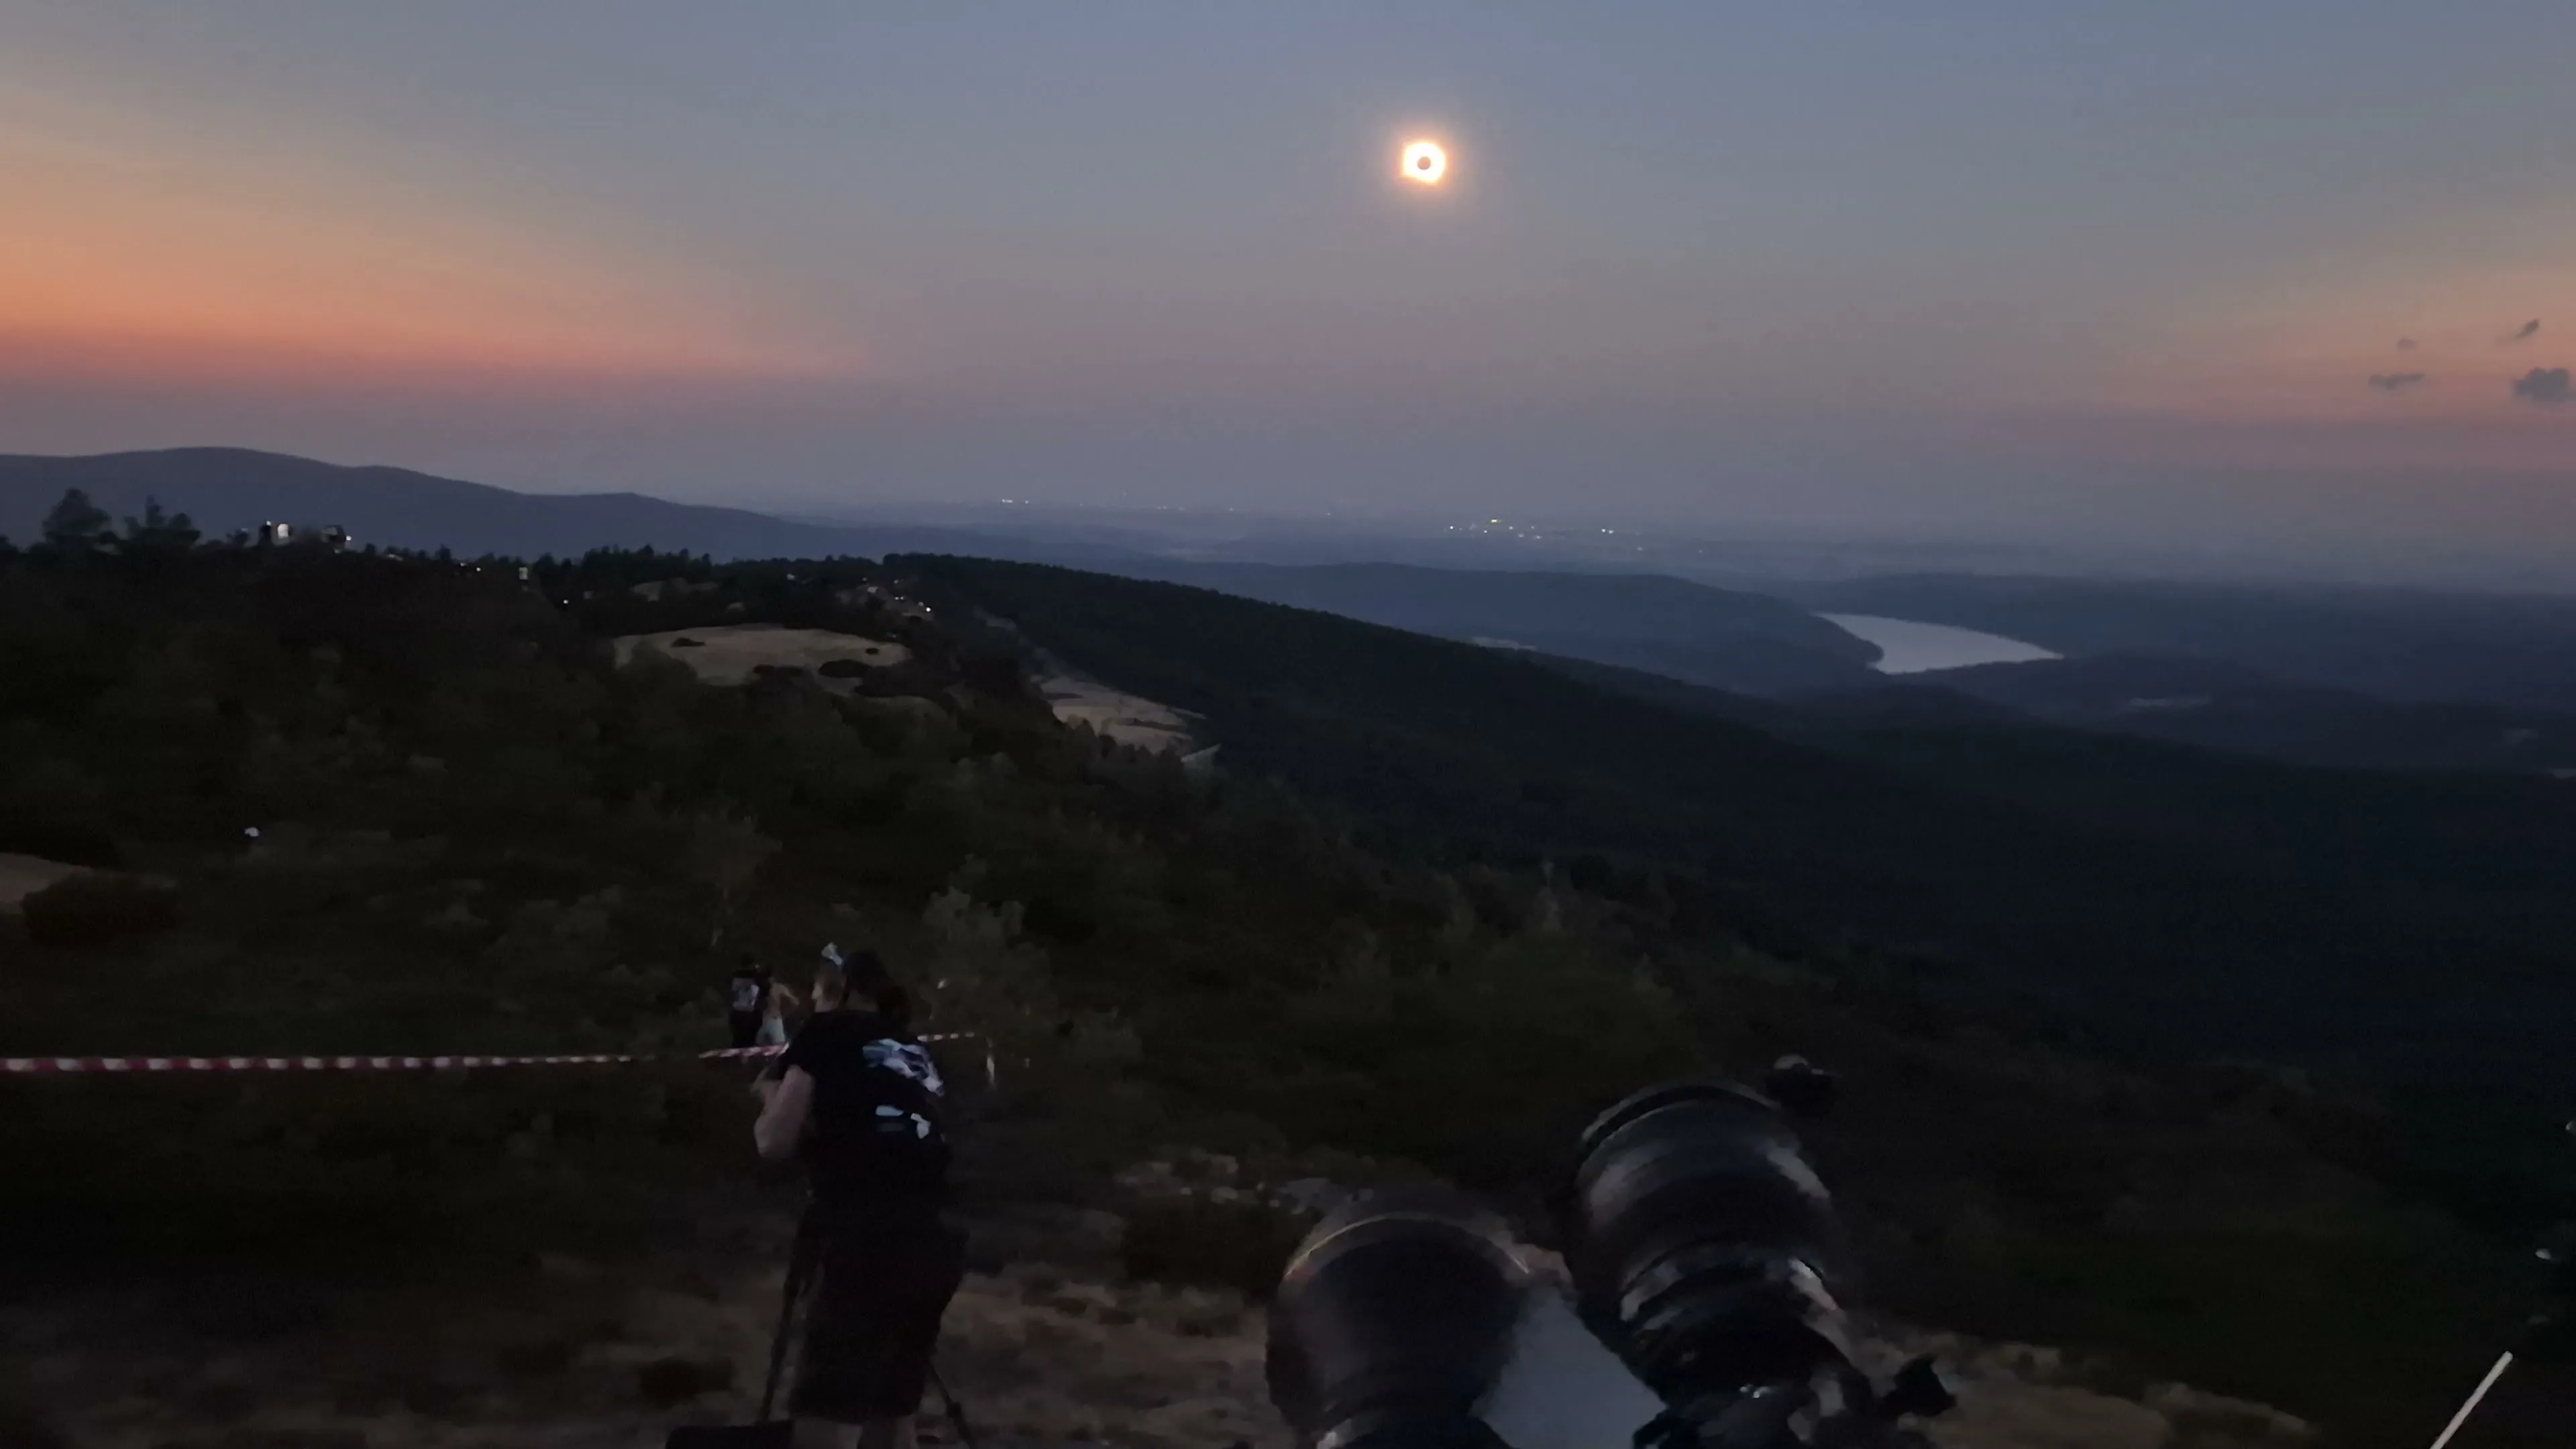
White-light cameras
- Measures
- The corona’s visible light across a broad range of colors. In white-light images, streamers and prominences show the large-scale shape of the corona.
- Question
- How the corona and its magnetic fields are structured, and how they change.
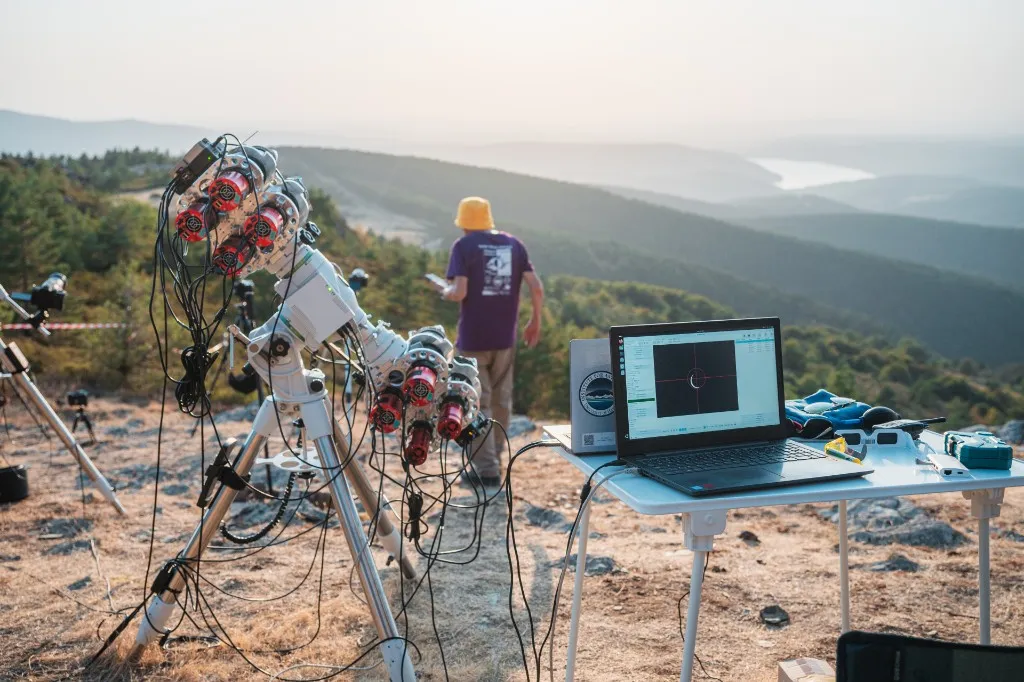
Narrow-band filters
- Measures
- Narrow slices of the spectrum, including emission lines of ionized iron such as Fe XI and Fe XIV. Comparing those lines shows where hotter and cooler plasma lies.
- Question
- Why the corona is so hot, and where the solar wind begins.
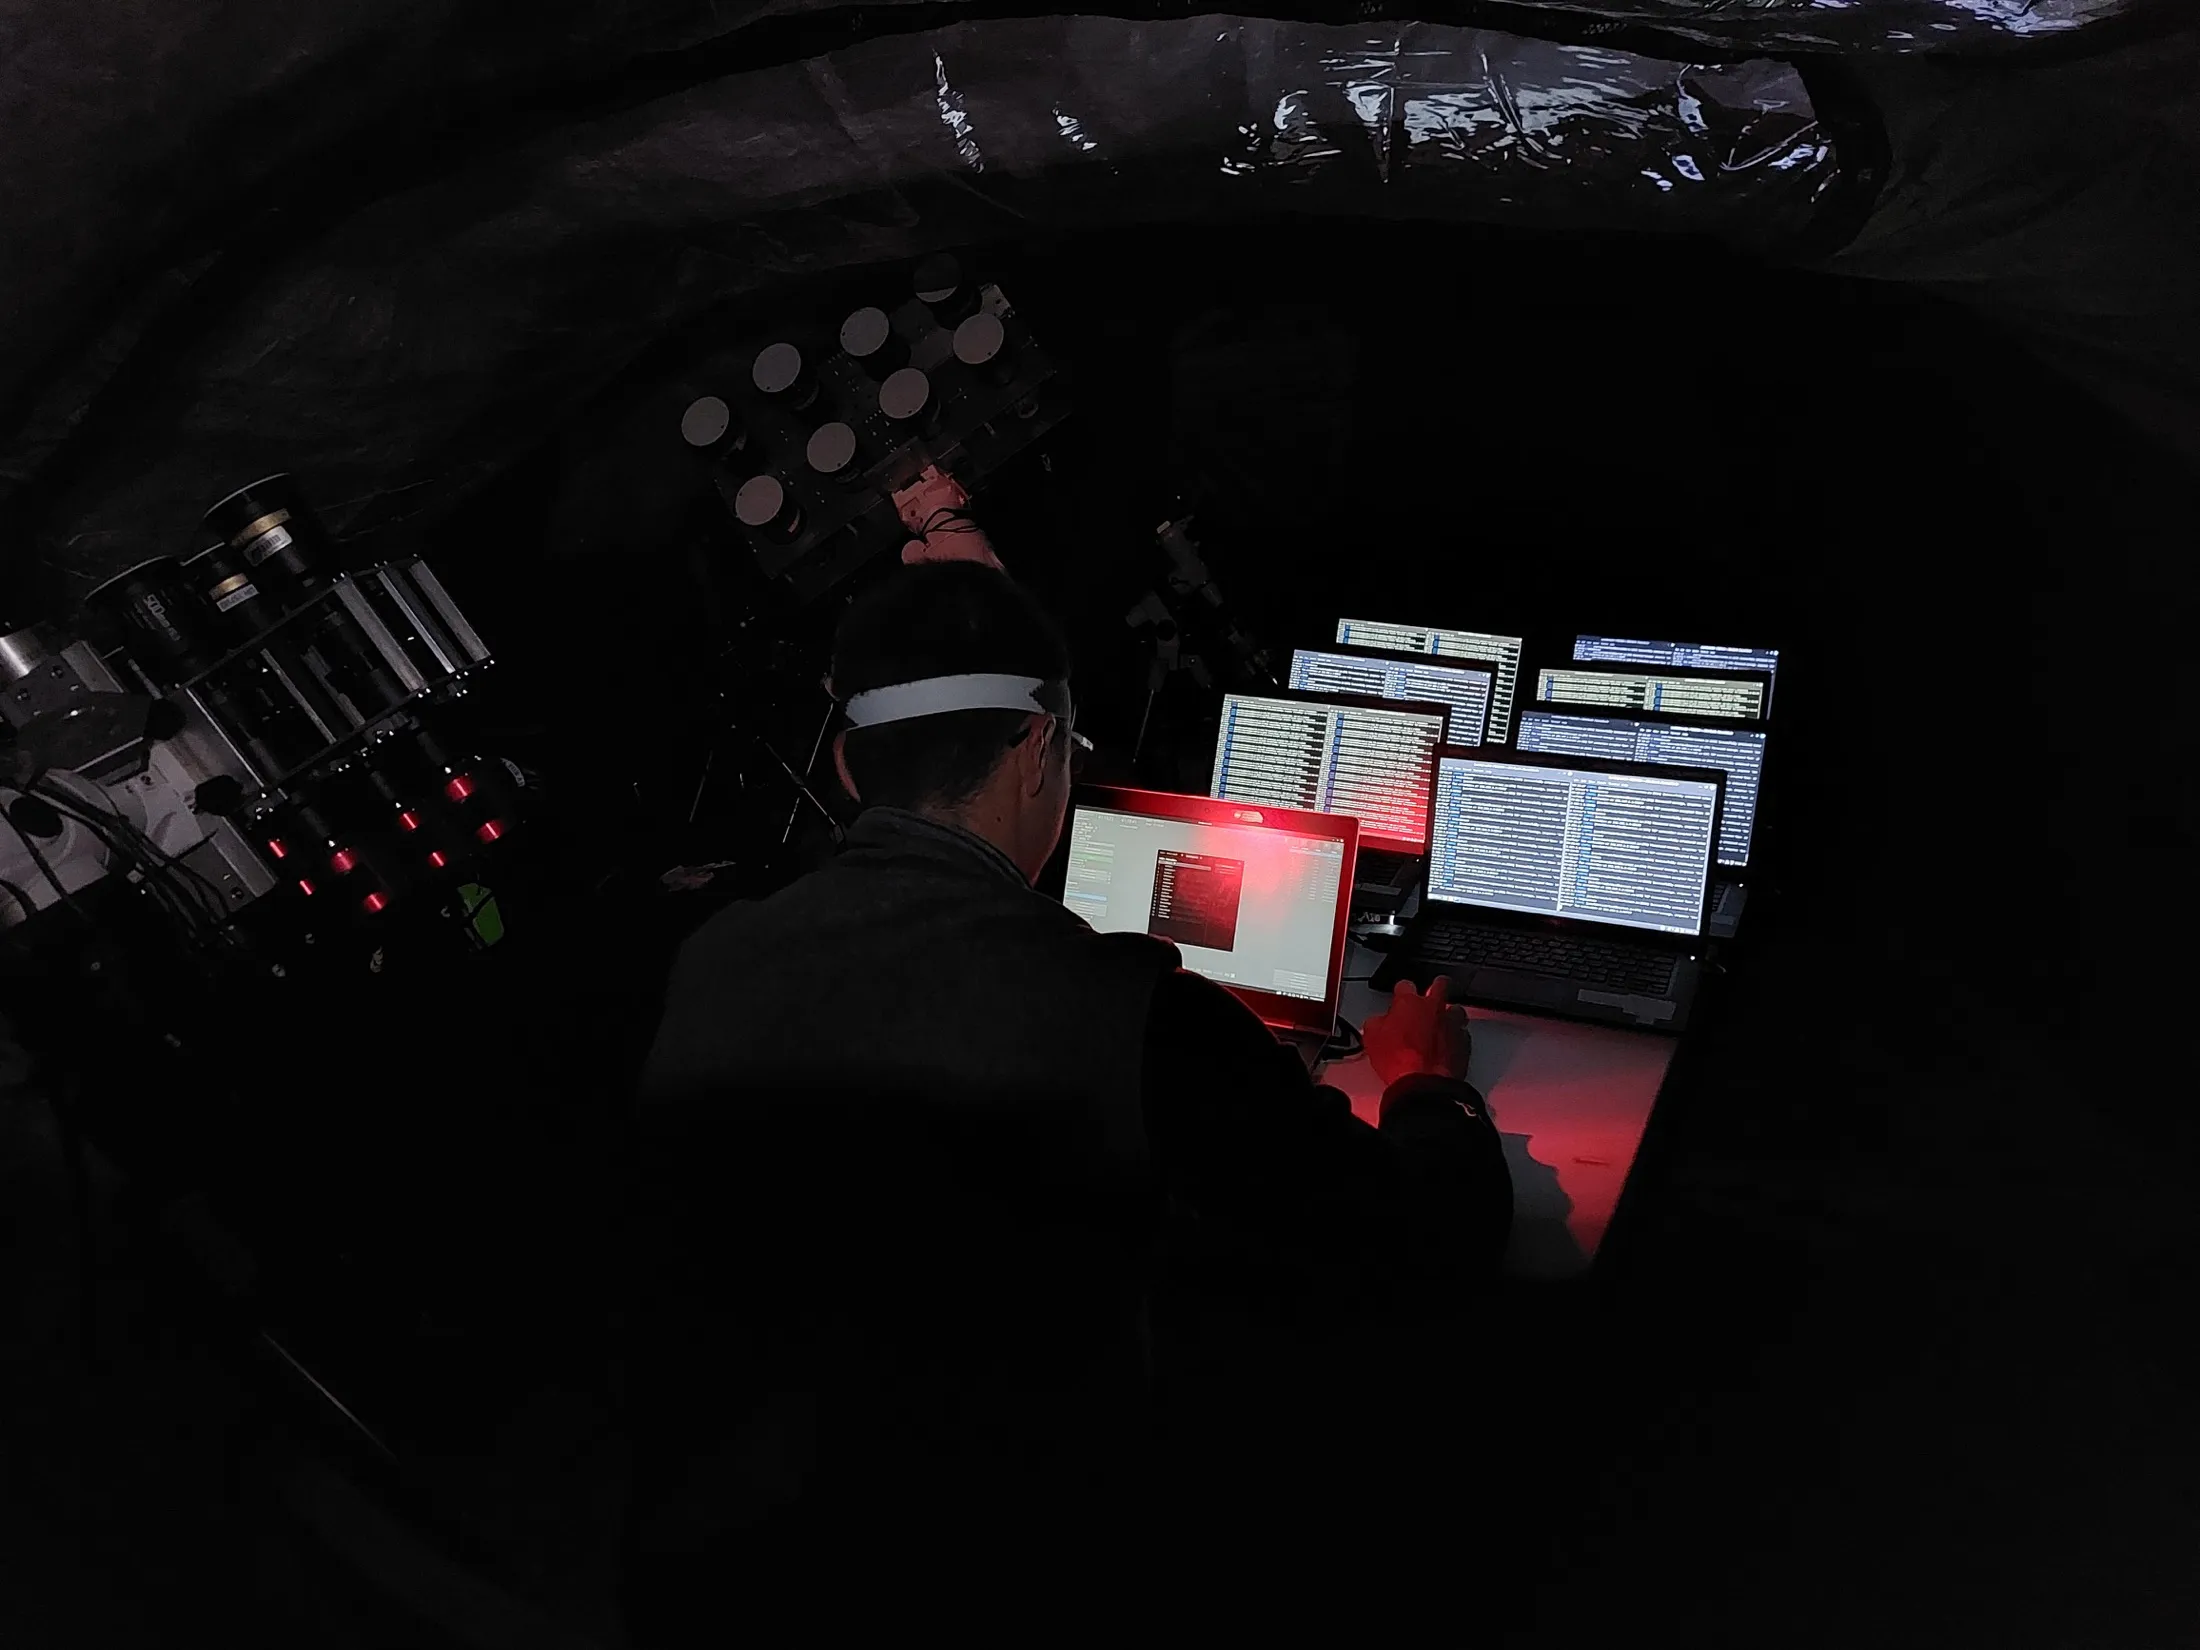
Spectrometers
- Measures
- The spectrum of coronal light, so individual emission lines can be separated and studied. Spectra are part of how the team examines temperature and motion.
- Question
- How the corona is heated, and how it moves.
How the work proceeds
From observations to knowledge
The images below follow one published example: the total solar eclipse of 20 March 2015, and the analysis in Boe et al. 2018. The field photograph is from the Faroe Islands that year. The corona images are figures from the paper.
- 01
Preparation and calibration
The instruments are set up, aligned, and tested before totality. The few minutes of darkness are too short to fix a problem once the Moon’s shadow arrives. The photograph is the field camp, not a calibration frame.
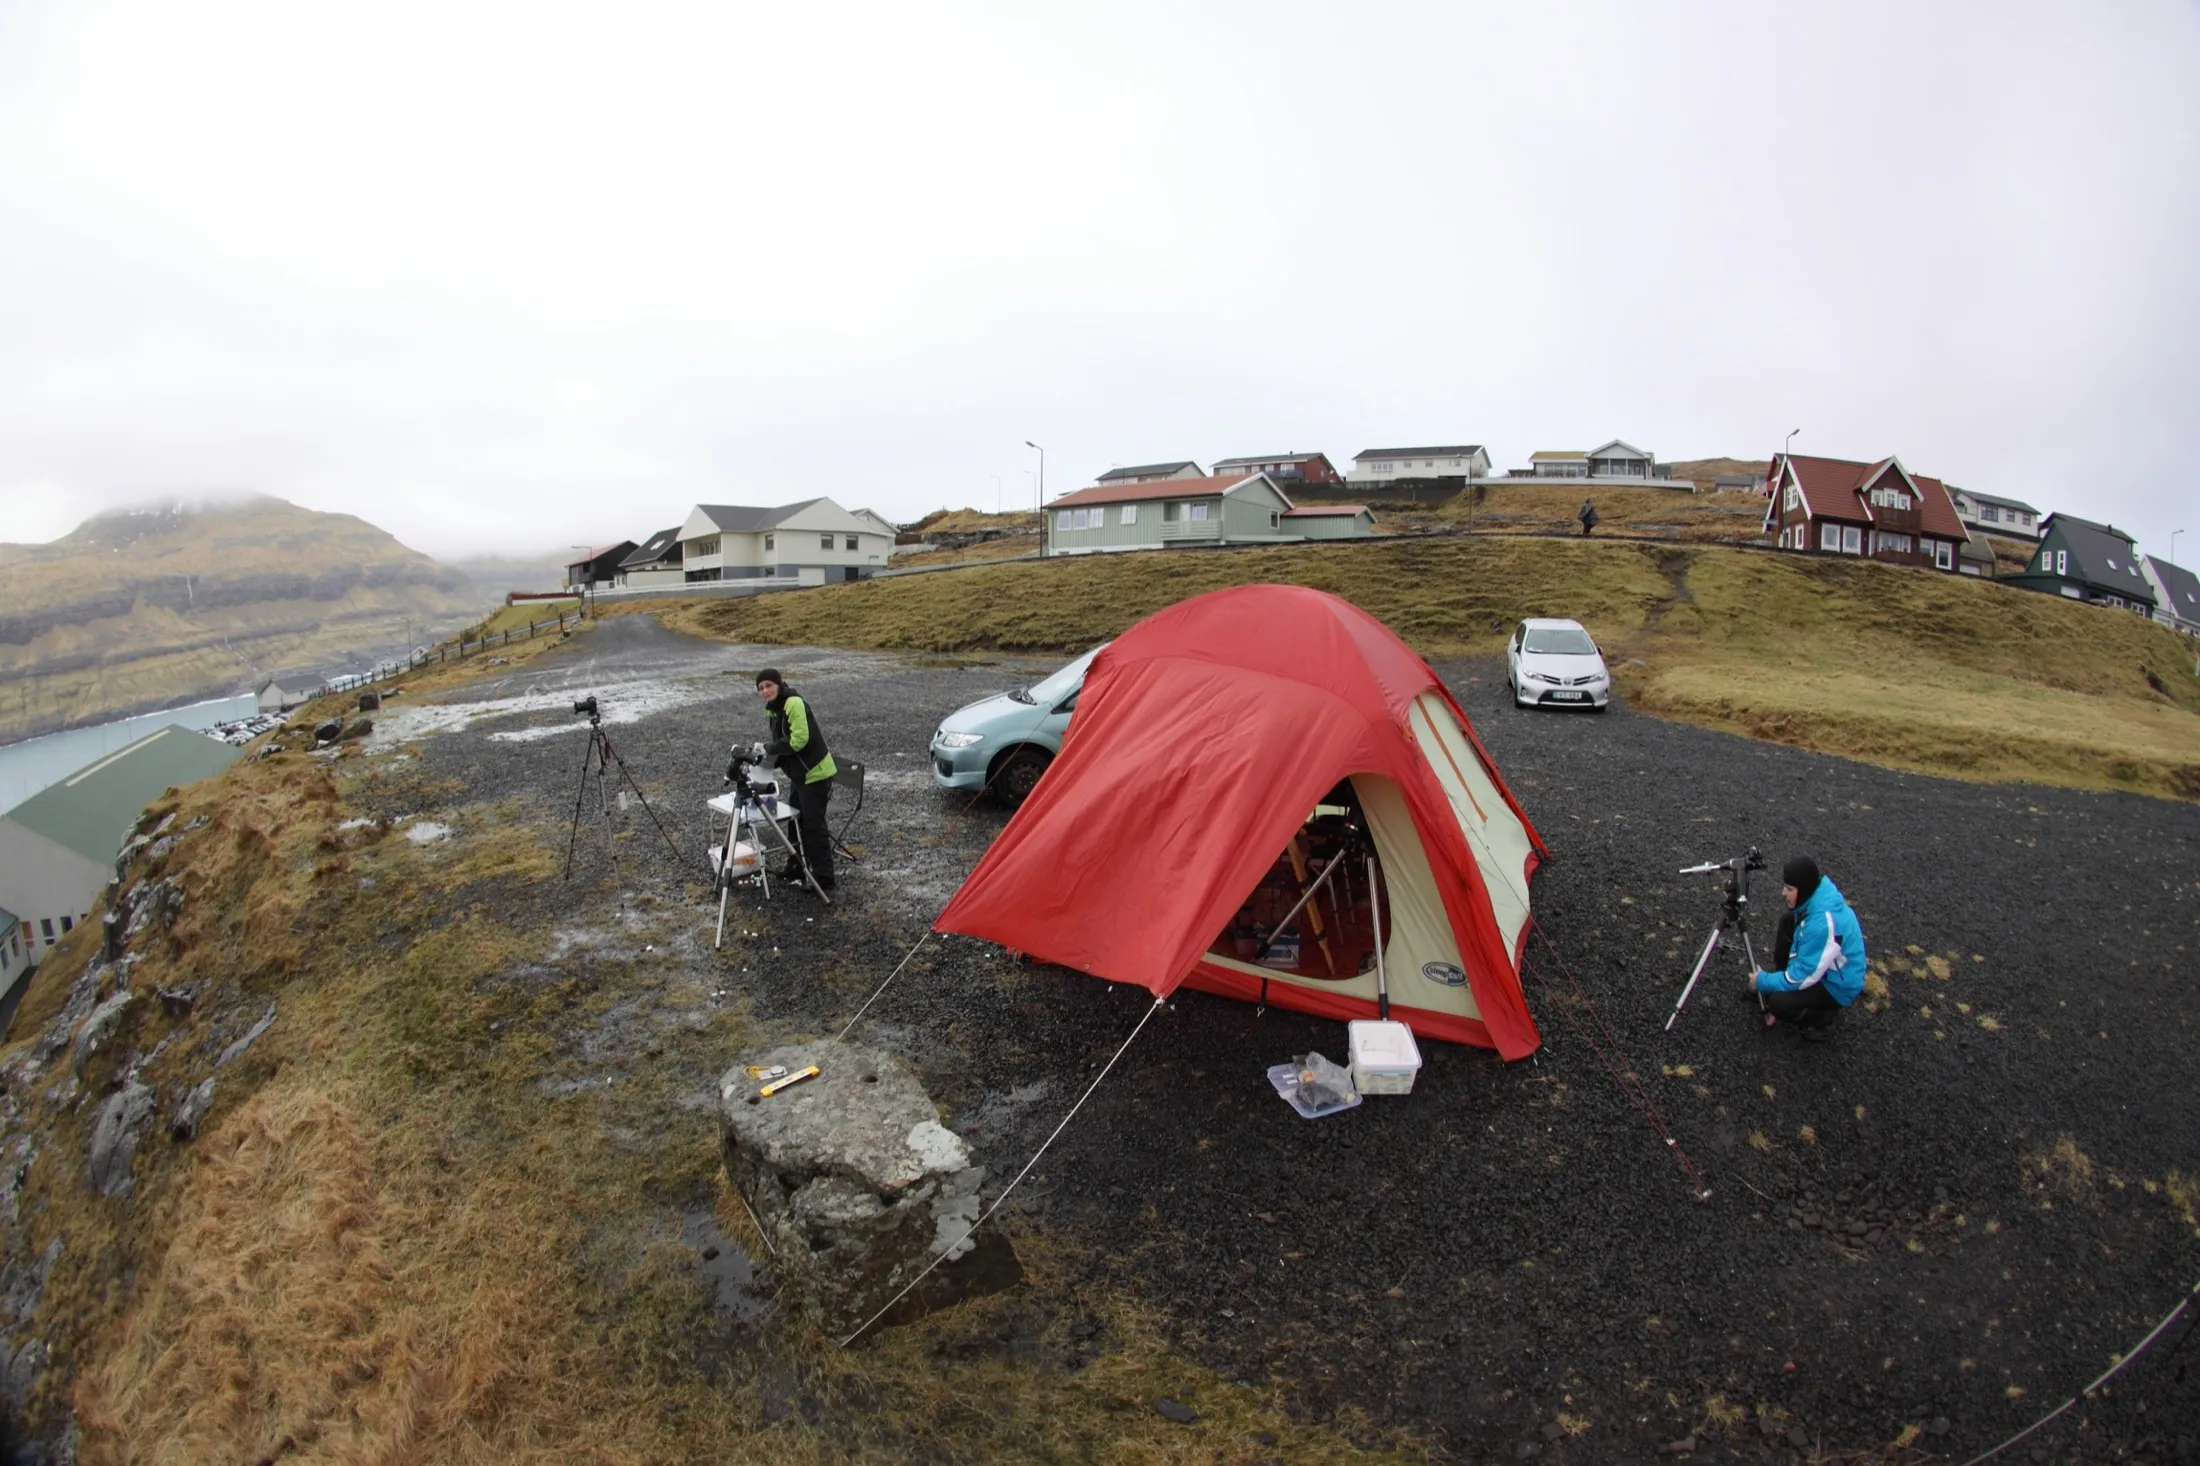
Field camp before the eclipse.Faroe Islands, 2015 - 02
Observation and data collection
During totality the cameras record the corona in white light and through the narrow-band filters. A raw frame from this eclipse is not shown here. The image is the processed white-light view published as Figure 1A, made so faint rays can be seen.
The same white-light image as at the top of this page, published as Figure 1A.Boe et al. 2018, The Astrophysical Journal - 03
Processing and analysis
Processing changes the contrast so faint structure can be seen. It does not add features that were not recorded. The panels then separate two emission lines from the white-light view. Fe XI is the line at 789.2 nm, in the near-infrared. Fe XIV is the line at 530.3 nm, in the green. In the figure, Fe XI is given a red display color and Fe XIV a green one, so the two measurements can be compared. The corona does not have those colors in the sky.
- White light. Processed so faint rays can be seen. The gray tones are contrast, not the color of the sky.
- Red. A display color for Fe XI (789.2 nm). That light is near-infrared, not red.
- Green. A display color for Fe XIV (530.3 nm), which is a green line.
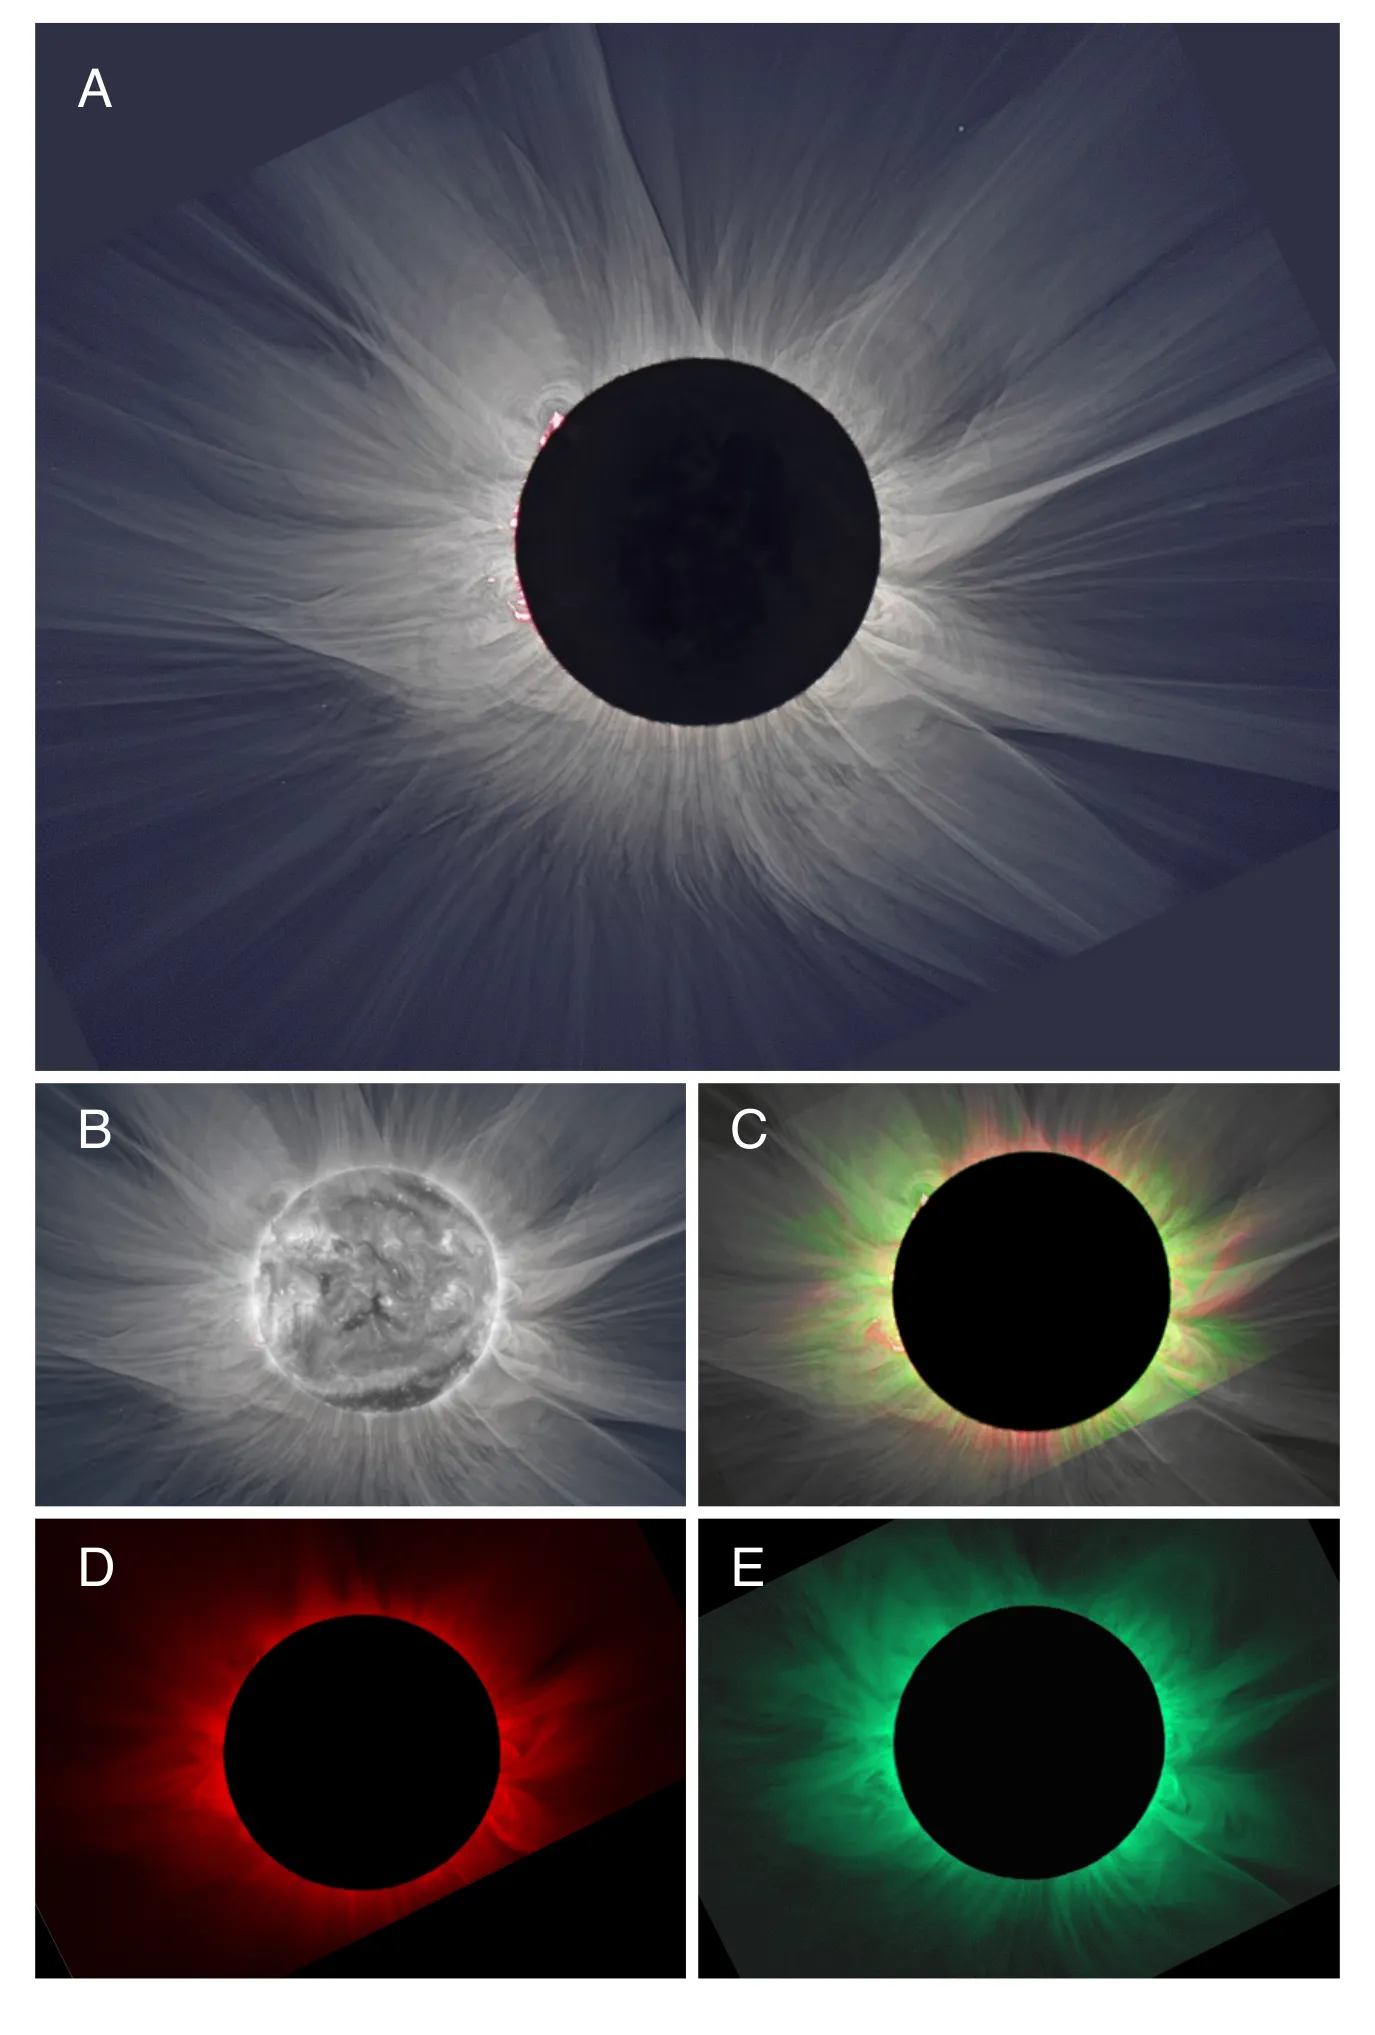
Figure 1 of Boe et al. 2018. Panels A and B are white-light views. Panels D and E show one emission line each. Panel C combines them.Boe et al. 2018, The Astrophysical Journal - 04
Interpretation and publication
The measurement is where each emission line is bright. The paper’s interpretation is where two iron ions settle into the charge states they then carry outward with the solar wind, and what that suggests about conditions near the Sun. That conclusion is argued in the paper. It is not written on the picture.
Read Boe et al. 2018
Results
Scientific contributions & publications
Two published papers are highlighted below. The list that follows is the reference for each one.
Published · 2018
Tracing the solar wind’s origins
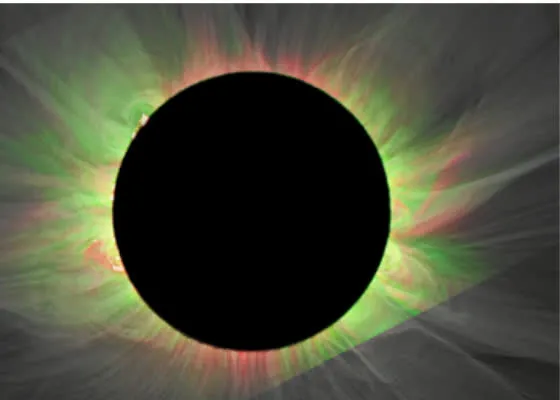
Observations from the 2015 eclipse helped identify where two types of iron ions settle into the charge states they carry outward with the solar wind, offering clues to conditions near the Sun.
The First Empirical Determination of the Fe¹⁰⁺ and Fe¹³⁺ Freeze-in Distances in the Solar Corona
View publicationPublished · 2014
Revealing fine structures in the corona
Detailed processing of eclipse images revealed faint loops, rings and twisted structures, providing new evidence of the corona’s dynamic behavior.
Discovery of a New Class of Coronal Structures in White Light Eclipse Images
View publicationSelected publications
Published
Tracing the solar wind’s origins
The First Empirical Determination of the Fe¹⁰⁺ and Fe¹³⁺ Freeze-in Distances in the Solar Corona
Published
Revealing fine structures in the corona
Discovery of a New Class of Coronal Structures in White Light Eclipse Images
Take Action
Be part of the journey.
Support Our Work
Help make eclipse science possible.
Support the expeditions, instruments and research that deepen our understanding of the Sun.
Expeditions · Data analysis · Instrumentation · Early-career researchers
Contact
Start a conversation.
Interested in supporting the project, exploring a collaboration or asking a question? Get in touch.
contact@solarwindsherpas.comStay Informed
Follow the next chapter.
Subscribe for updates on our expeditions and solar research.